
Use Cases
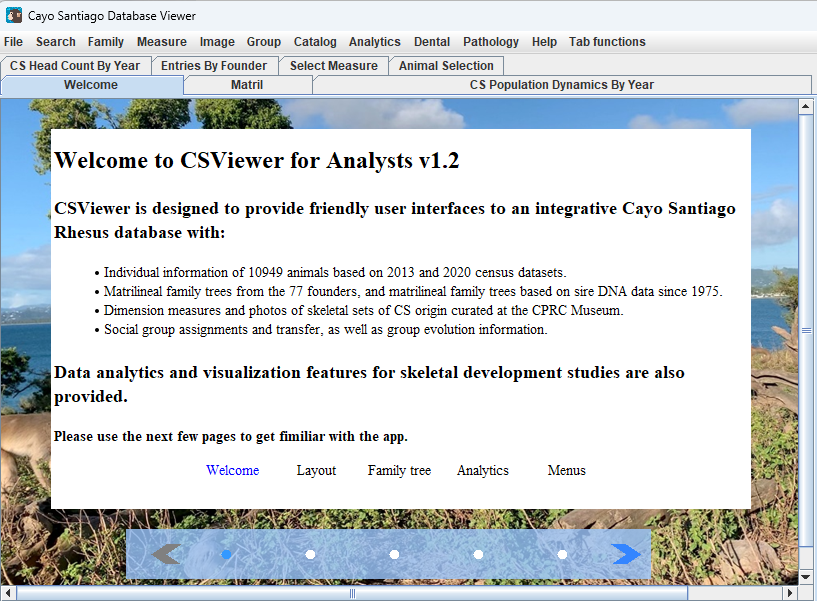
CSViewer for Analysts v1.2 helps researchers
(1) Explore the CS data using interactive family trees and static “big picture” visuals,
(2) Select animals and related measure data and carry out typical analytics and visualization tasks,
and
(3) Manage selected data and modeling results for output.
The CSViewer app organizes useful information in four areas (or panels):
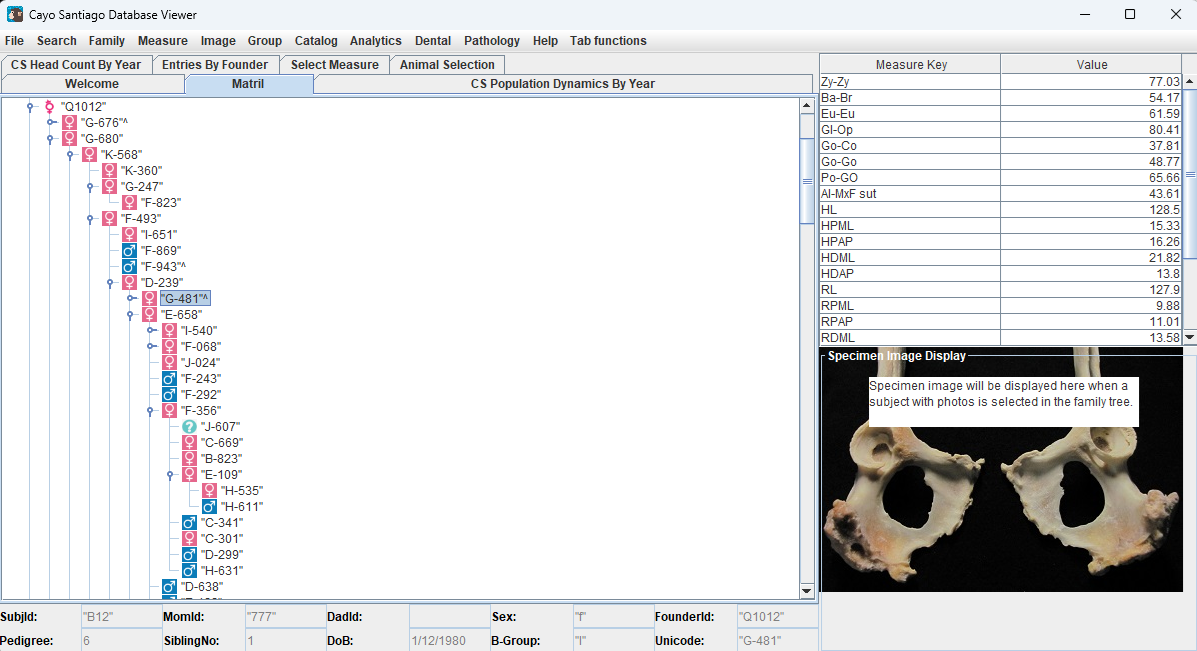
The “Bone Measure Table"
and
The “Specimen Image Display” panel will display measure and image data when available.
The "Main Content Panel" displays selection forms and significant results.
The bottom area beneath is the "Animal Info Summary" panel.
Explore Family Trees
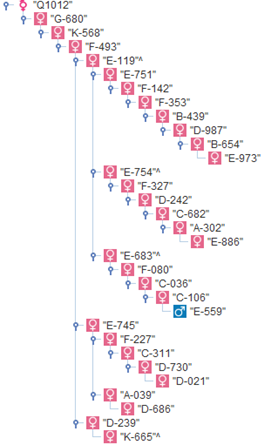
Show “Minimal Tree” in the Q1012 Family
Show “Patril Tree”
Users can explore information of 10949 animals o the CS Colony based on the most recent 2013 and 2020 census datasets.
The Family menu provides various kinds of family trees:
Matrilineal trees (from the 77 founders)
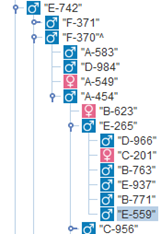
Patrilineal trees (based on sire DNA data since 1975)
Kinship trees (with up to three levels of ancestors and then jump to the founders).
Additional Features:
Show path generates the (M/Patril) tree all the way to a given animal.
Show descendants generates a “minimal” tree that includes only the subset provided and mothers on the paths to the common founder.
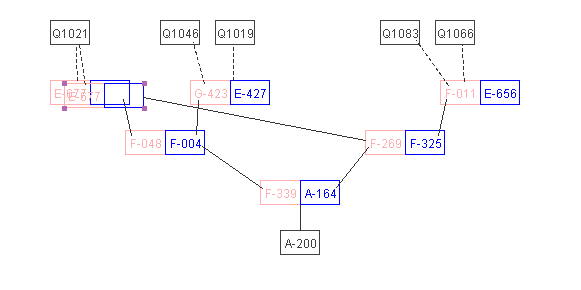
Show Kinship Tree for Subject A-200 (dashed lines indicating generations omitted)
Browse “Big Picture” Charts
Before selecting a dataset for their specific study, researchers can first get a “birdeyes” view of trends and distributions as reflected in the charts spreaded in the following menus.
Headcount line chart for the CS colony (1955~2020, Analytics | Headcount Trend)
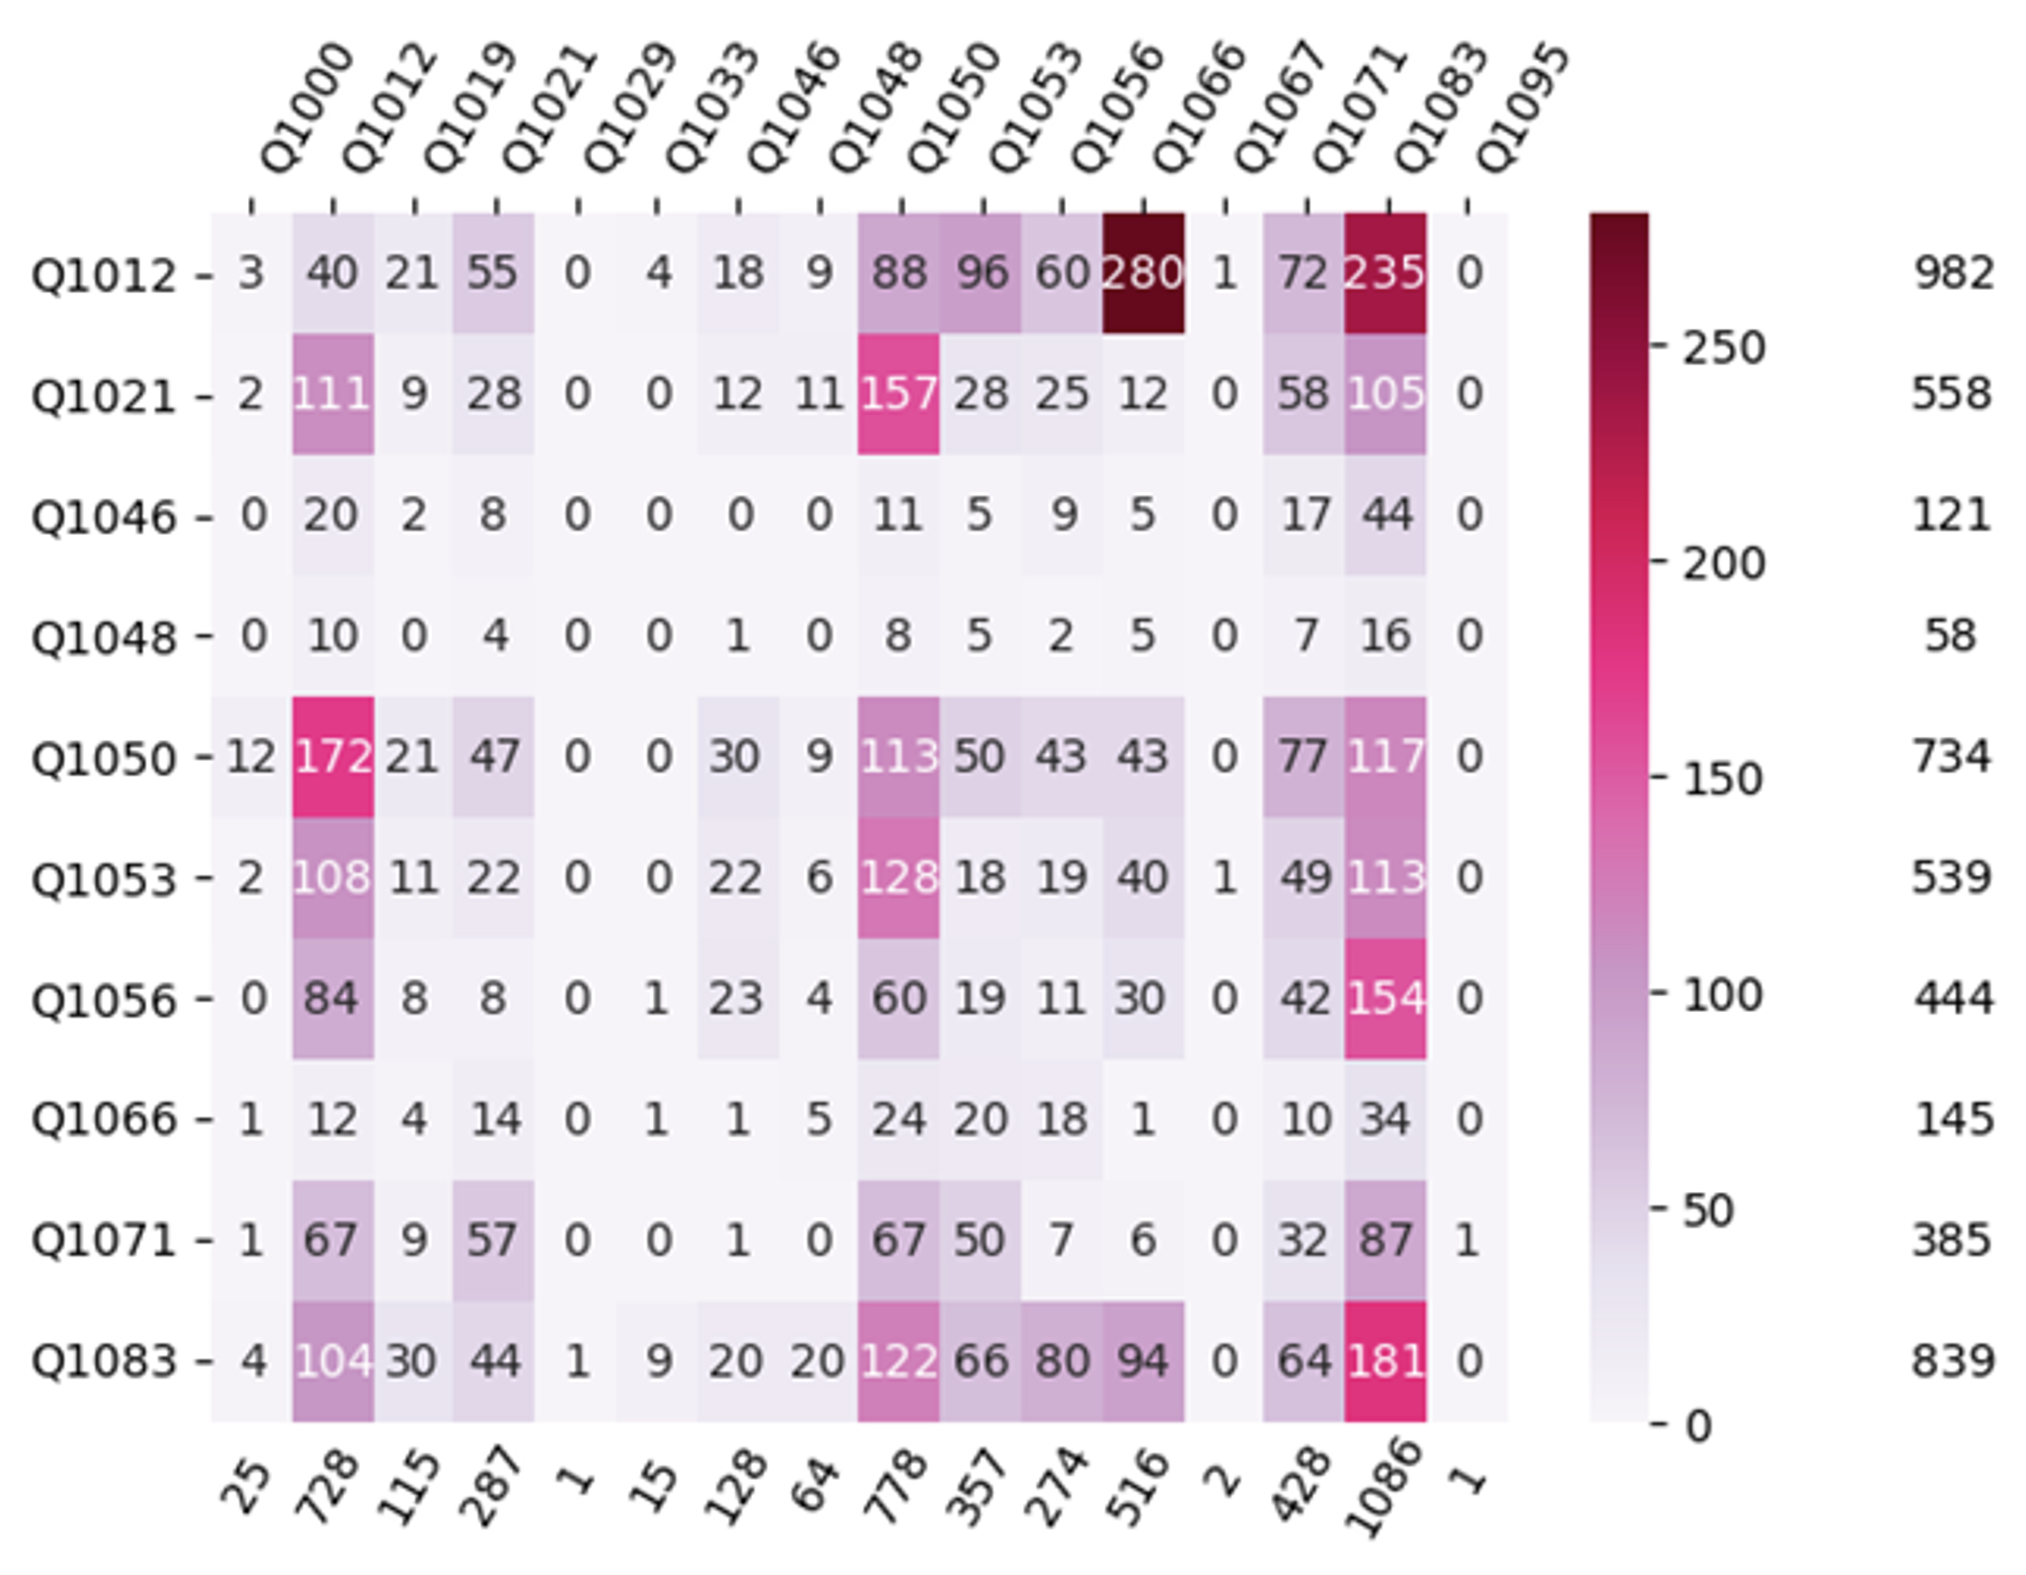
Heatmaps showing significant stats on entries in the CPRC museum
Entry counts by founder by pedigree (Catalog | Entries by Founder)
Entry counts by dam and sire families (Family | Family Interactions)
Entry counts by Birth Group by Family (Family menu)
Social group related stats (Group menu)
Historical group formation and evolution (1955~1976)
Birth count by group with group evolution (1955~2019)
Group interaction*
Sample group transfer and reproduction tracing
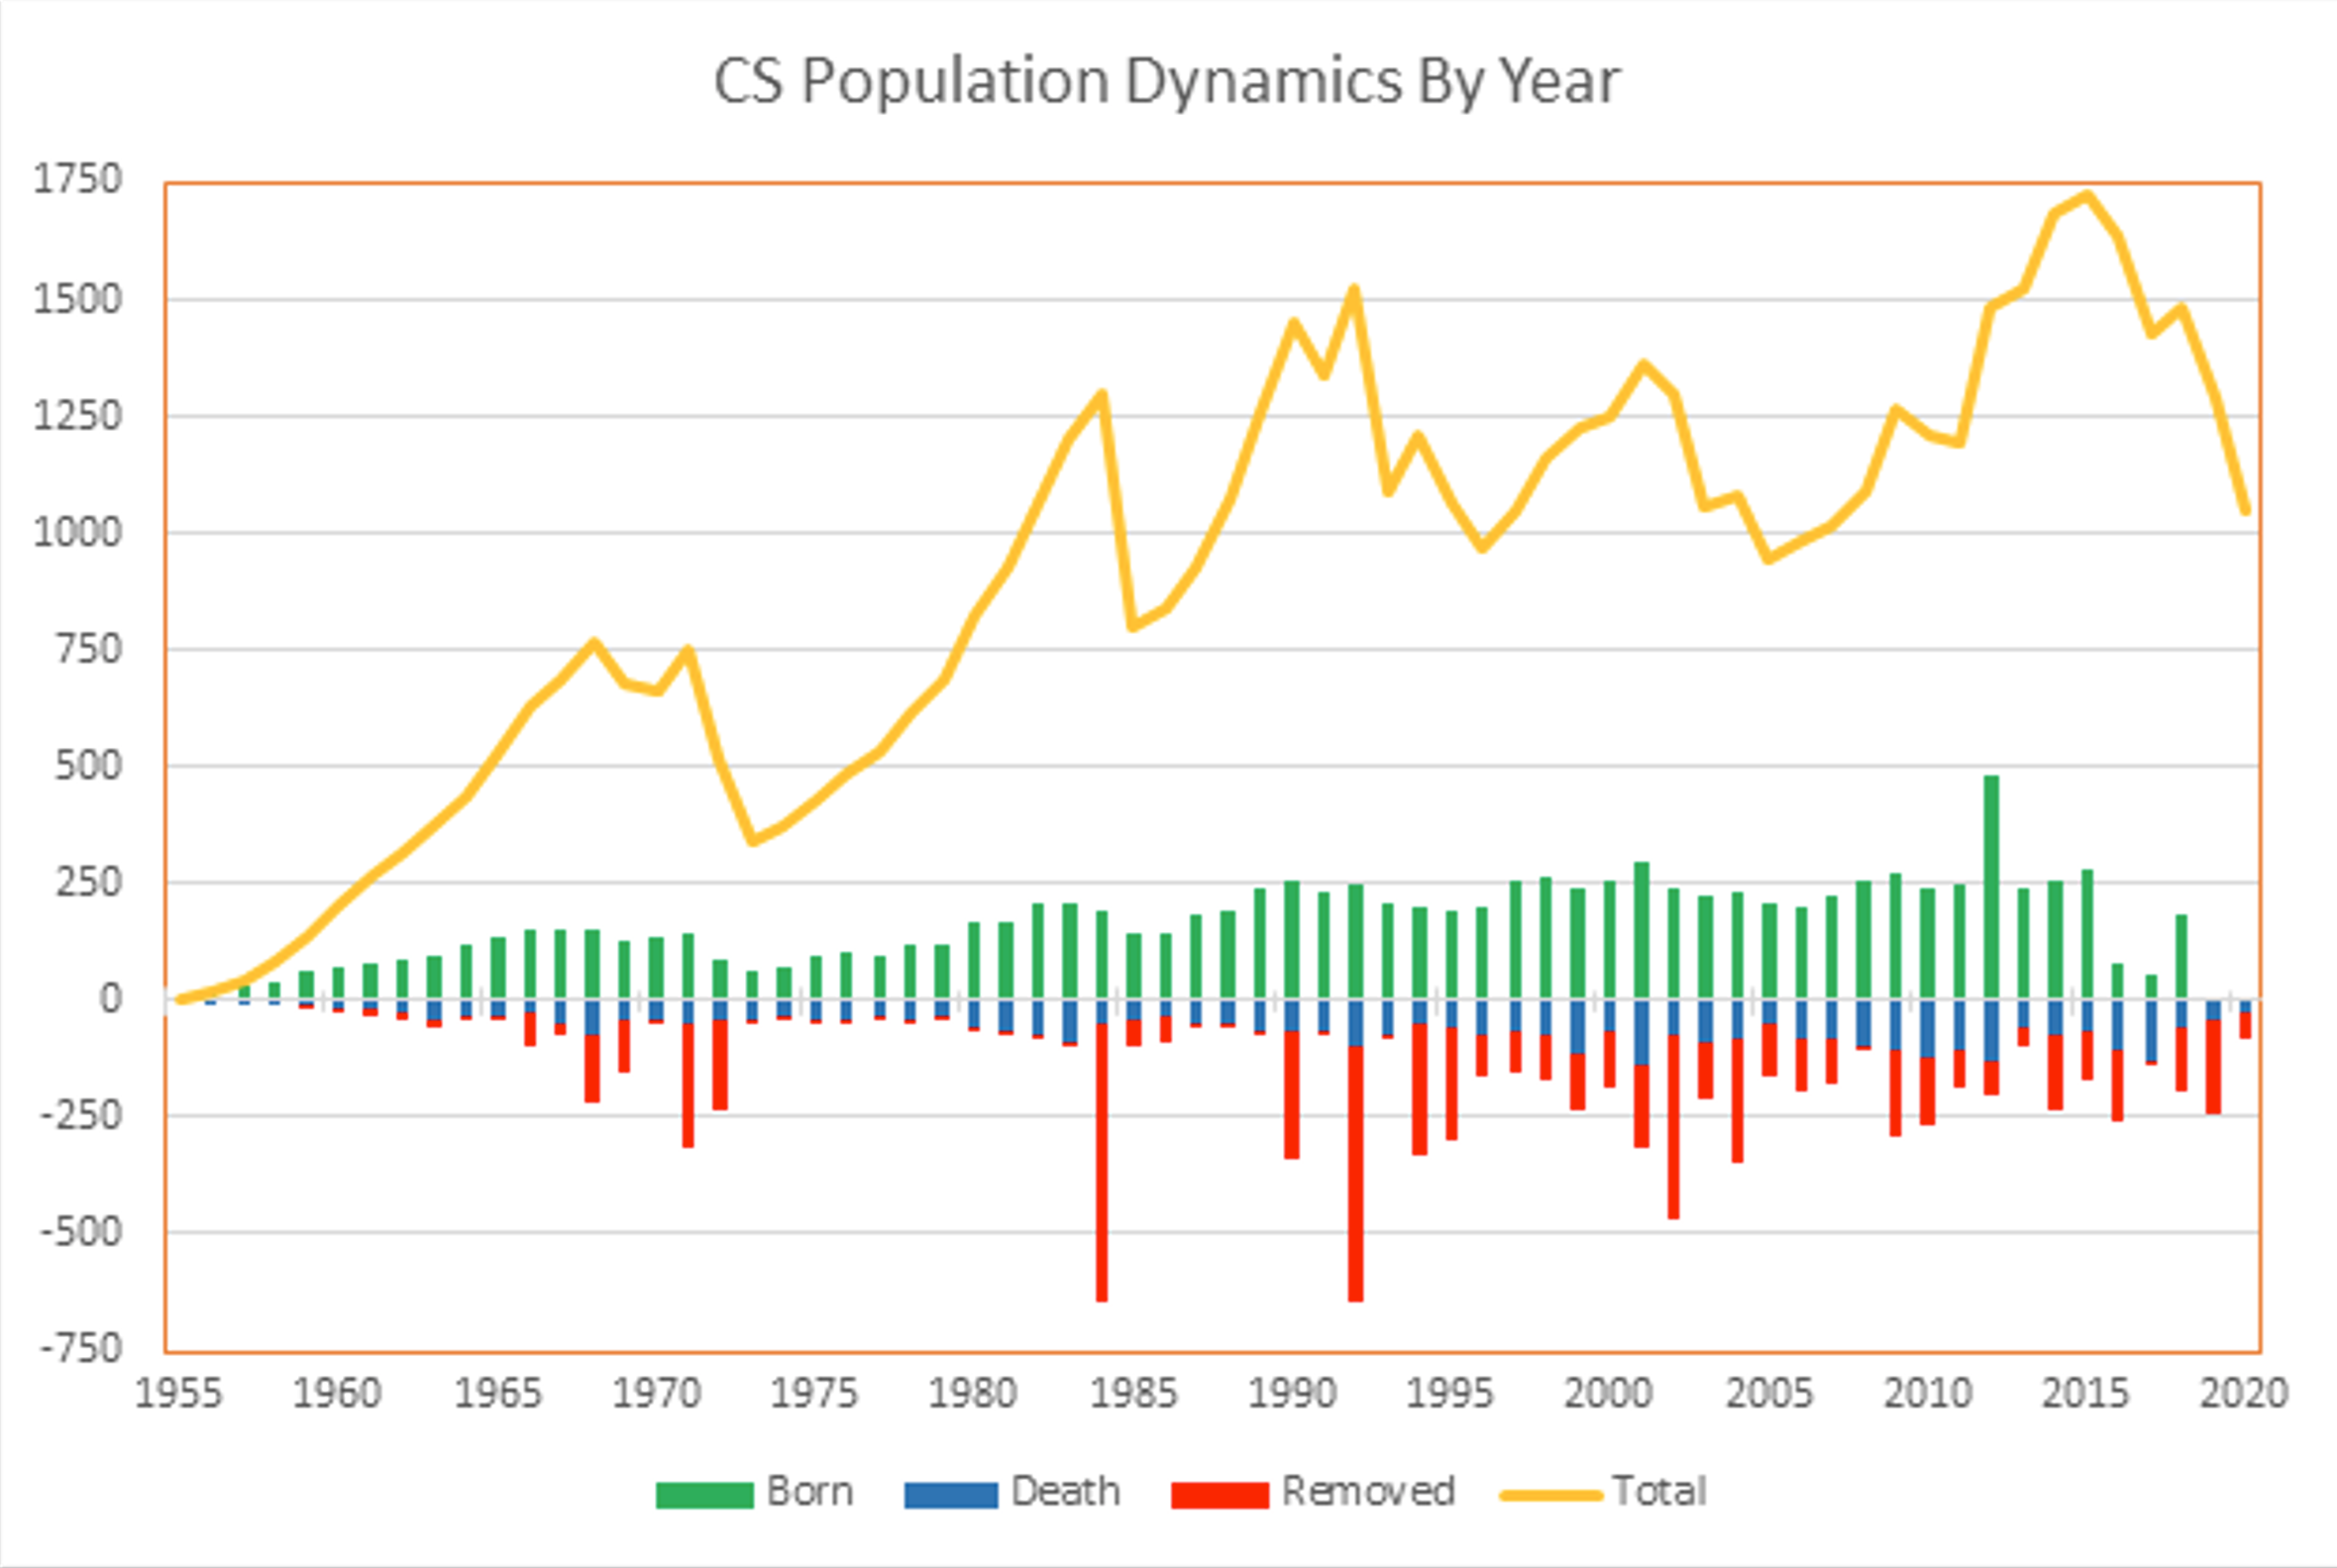
Headcount Line Chart
Family Interactions
Select Subjects and Bone Measures
A subset of animal subjects and targeted bone measures can be selected using features on the Search menu and the Measure menu.
Select subjects for study using the Search | Select Animal
Select from ALL families or any number of families
Select from birth seasons: ALL or any number of years
Select by subject sex: BOTH, Female, or Male
A cutoff Birth Date can be selected for making headcounts by year based on a specific day
Select measures
Show measure keys and protocols
Skull, upper and lower limb measures (mm)
Suture and joint measures (categorical)
Select measures: any measures in the same type (numeric or categorial)
Show “Joined Data Table”
Display data for selected subjects and measures
Optionally save the selected data as a CSV file
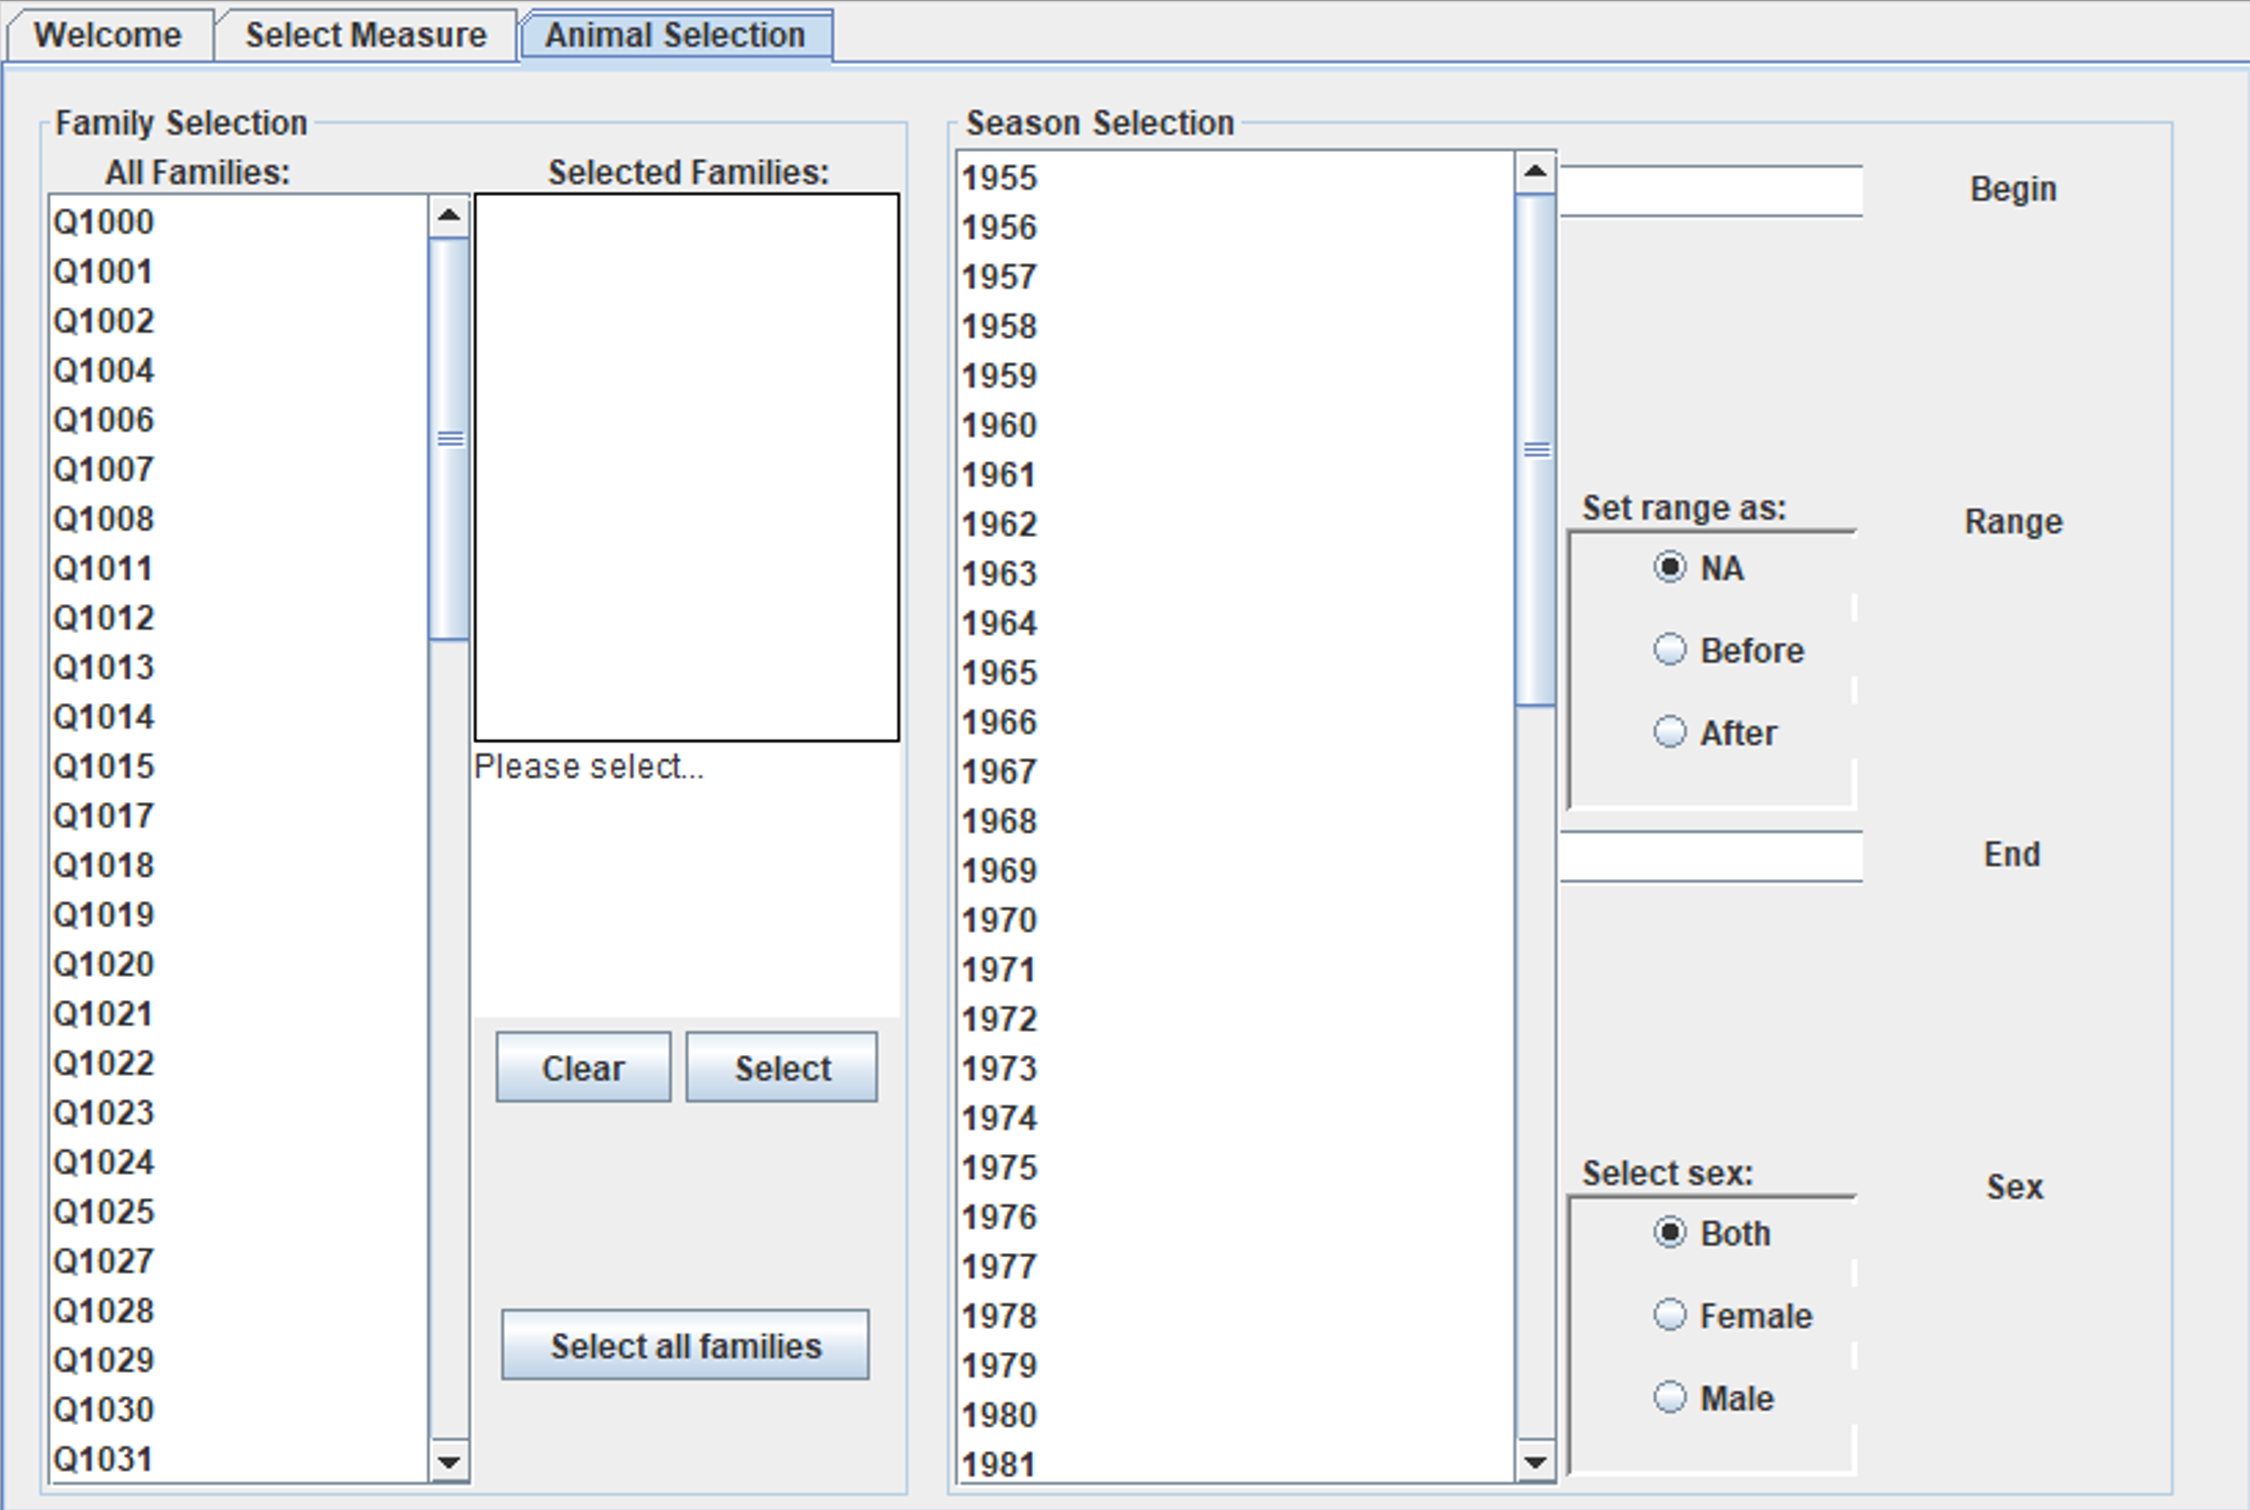
Animal Selection
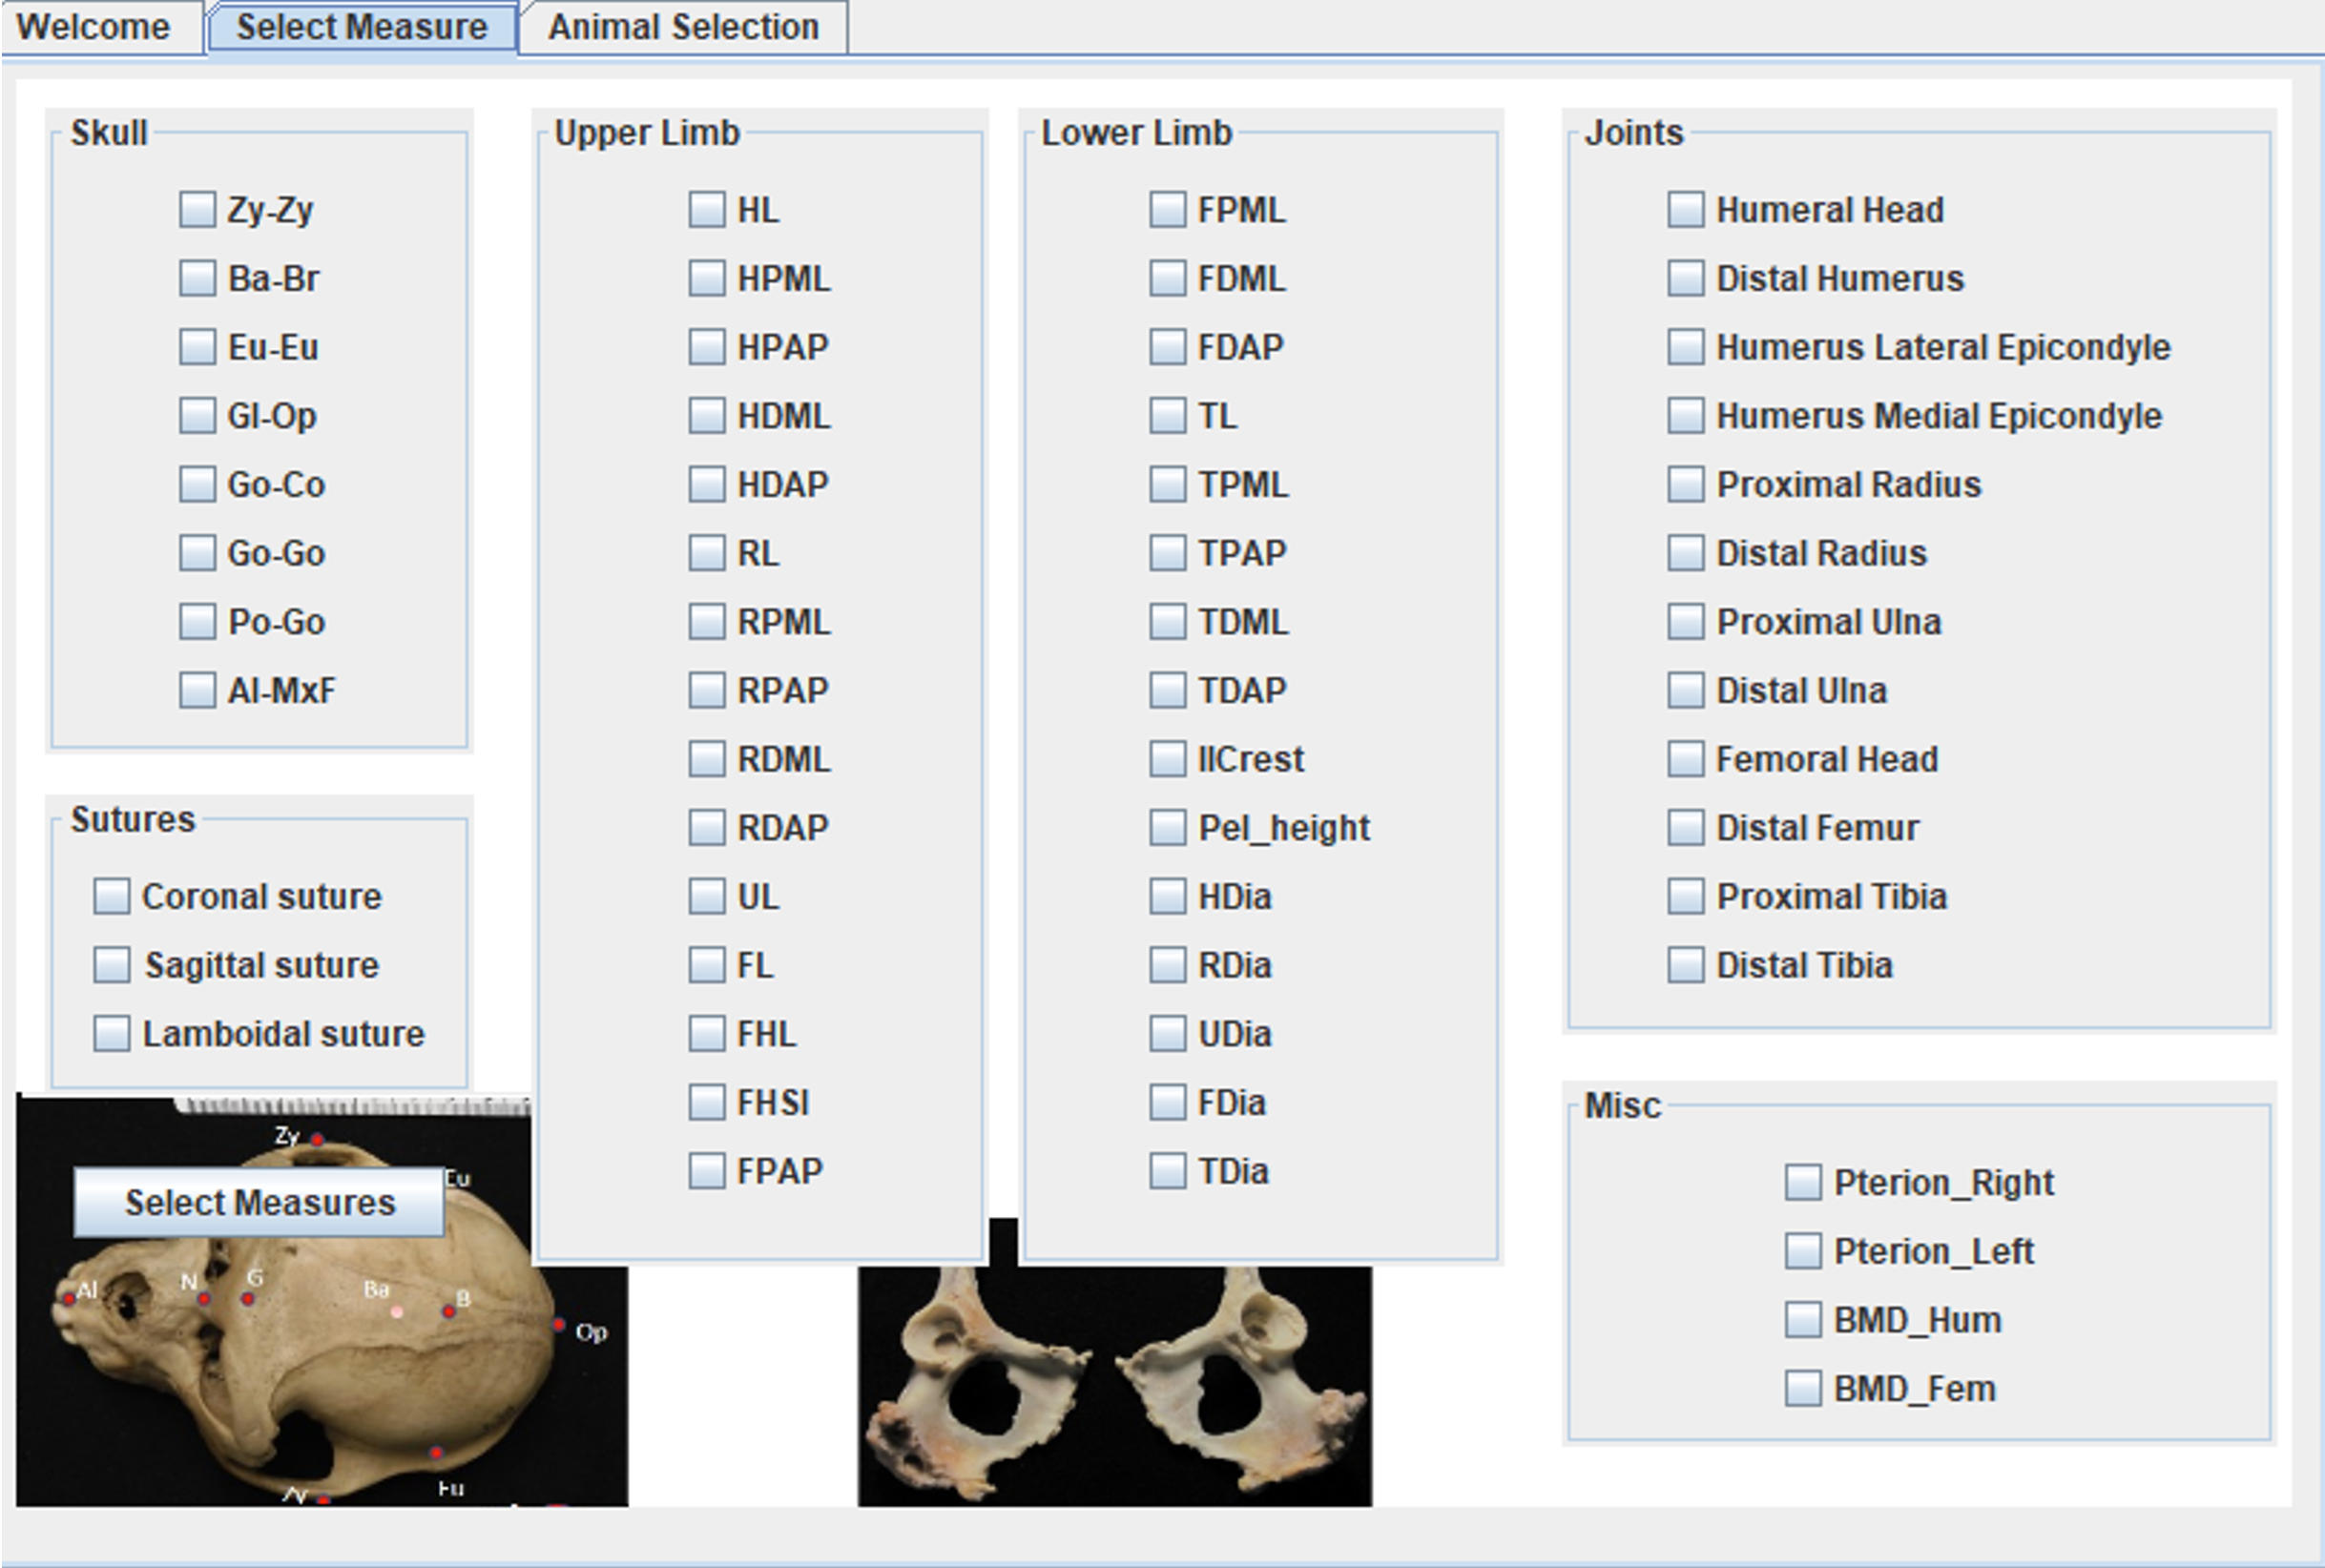
Measure Selection
Generate Charts (based on selected dataset)
Charts currently supported in CSViewer for Analysts v1.2 in the Analytics menu include:
Headcount line chart
Column chart for categorical data
Xy-plot for numeric data
Measures vs. EAAD (estimated age at death)
Measures vs. a selected measure
Histograms for numeric data
Box-and-whisker chart for numeric data
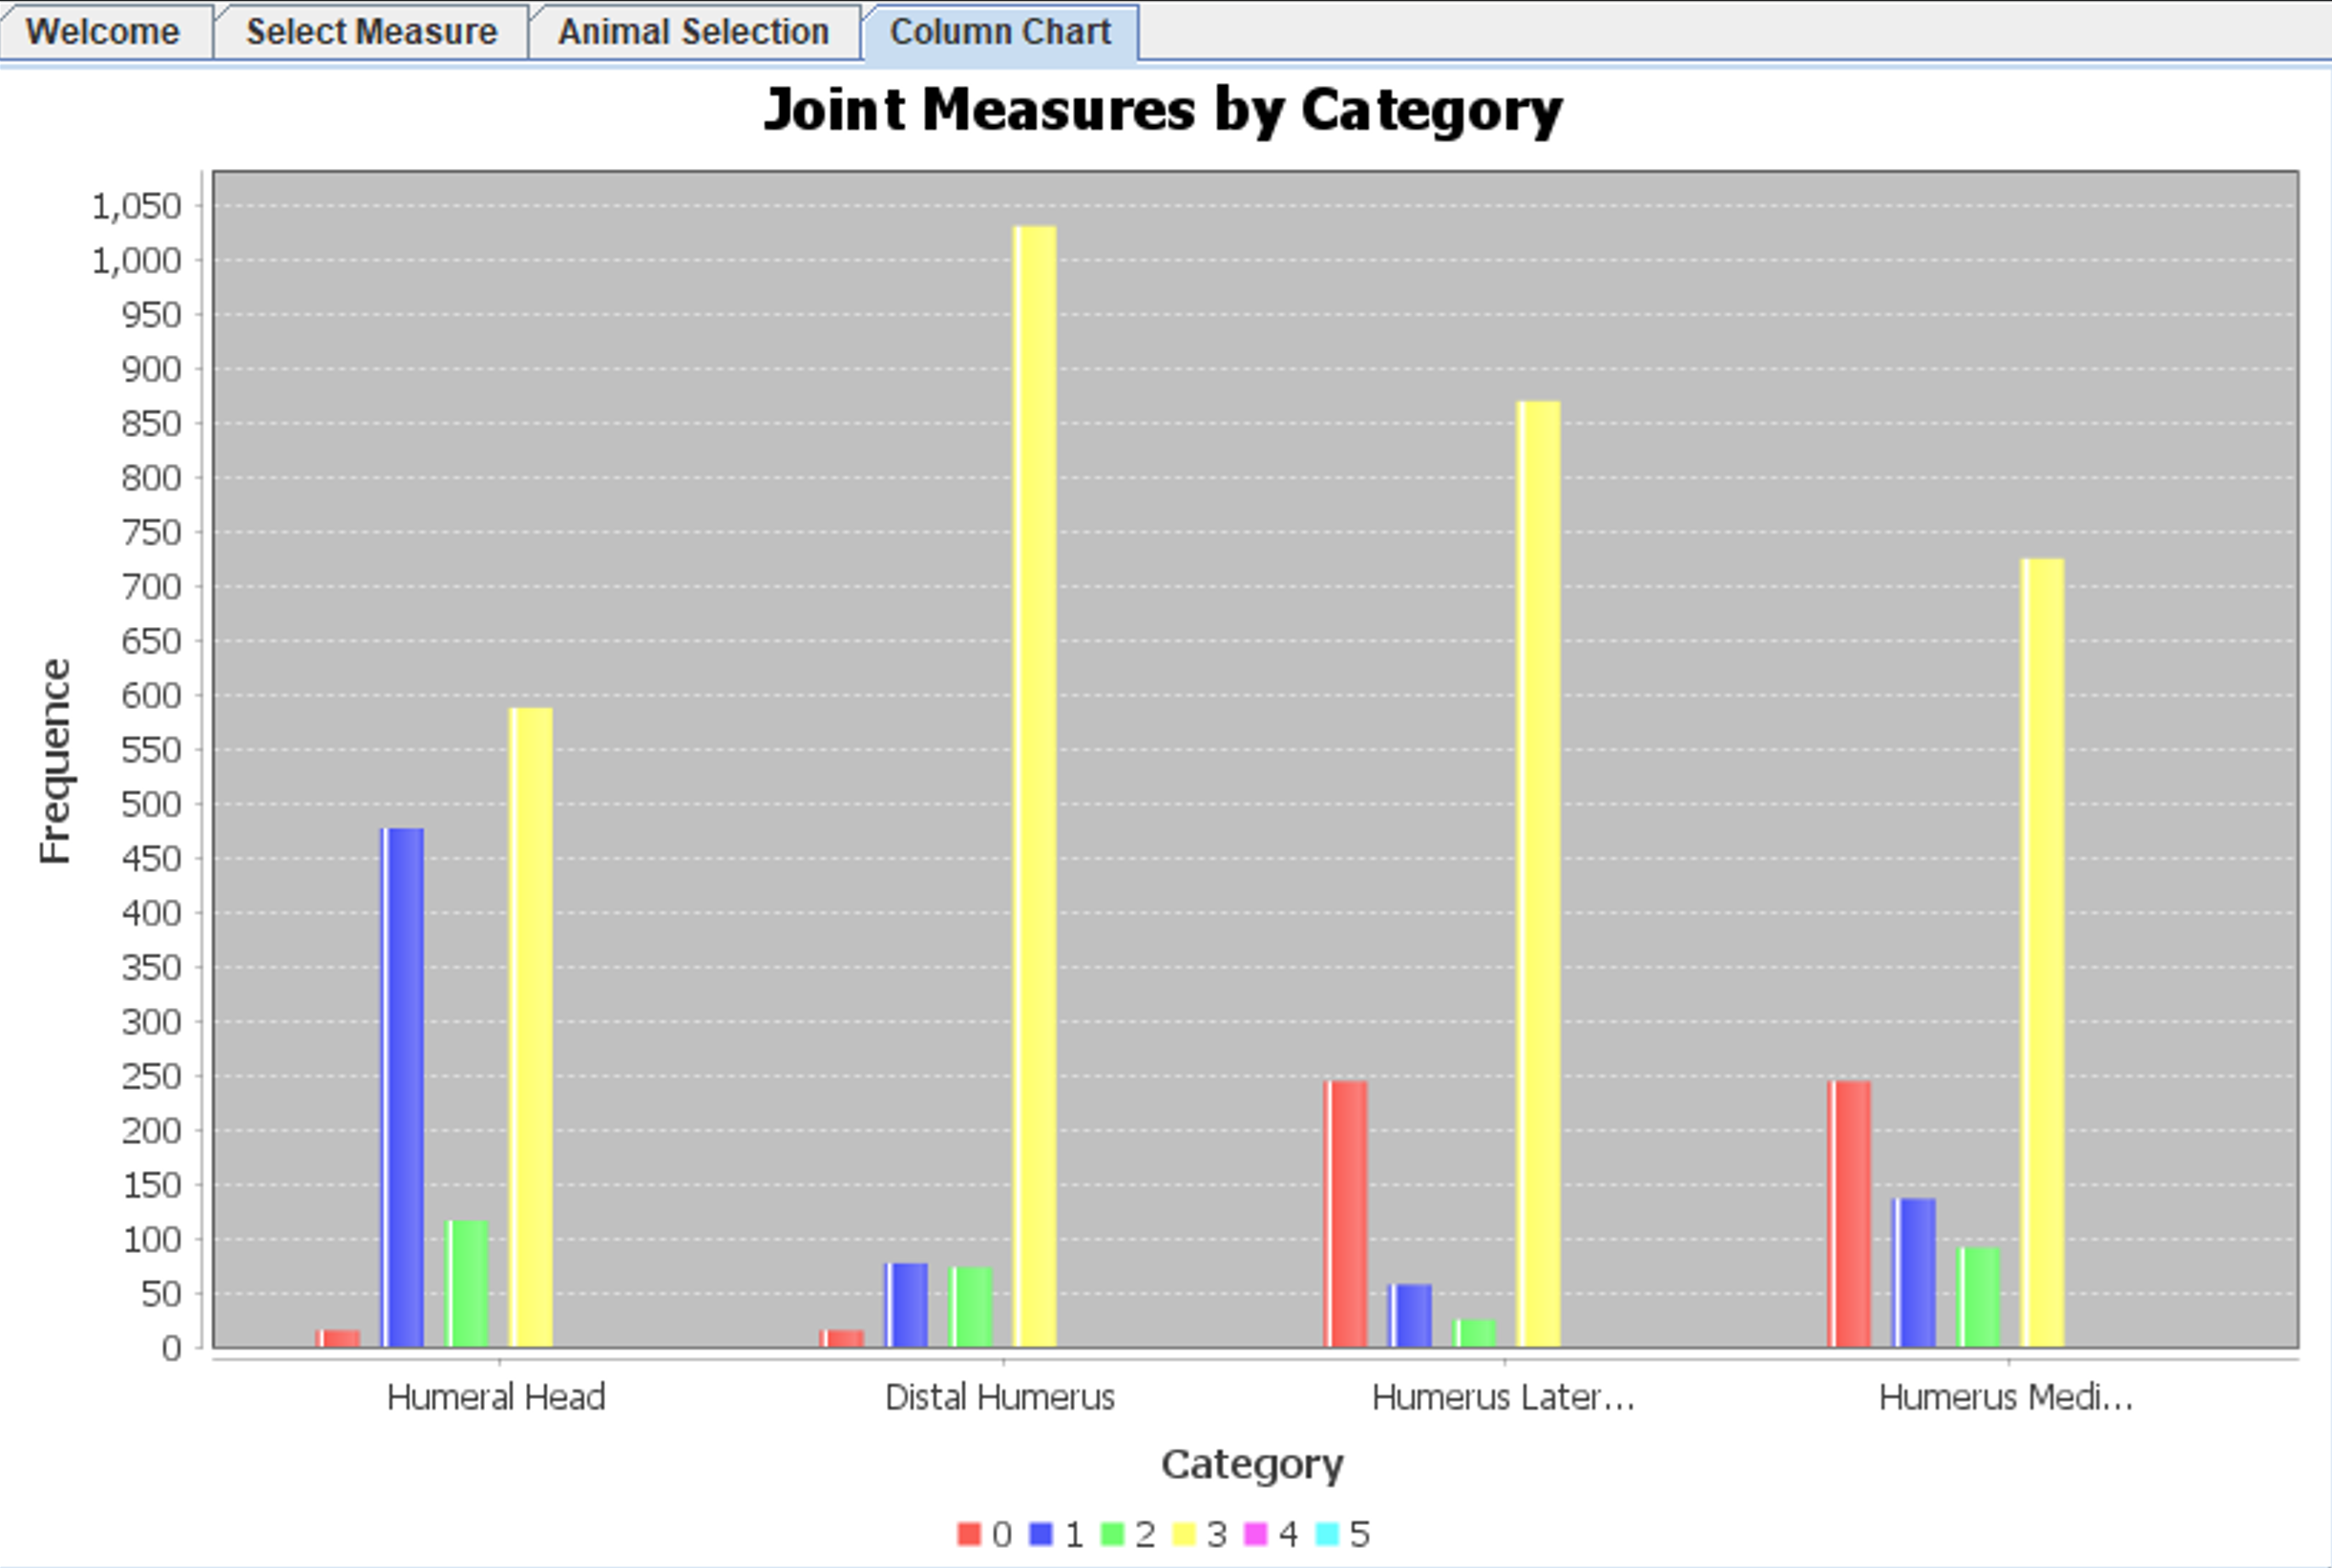
Column Chart for Categorical Data
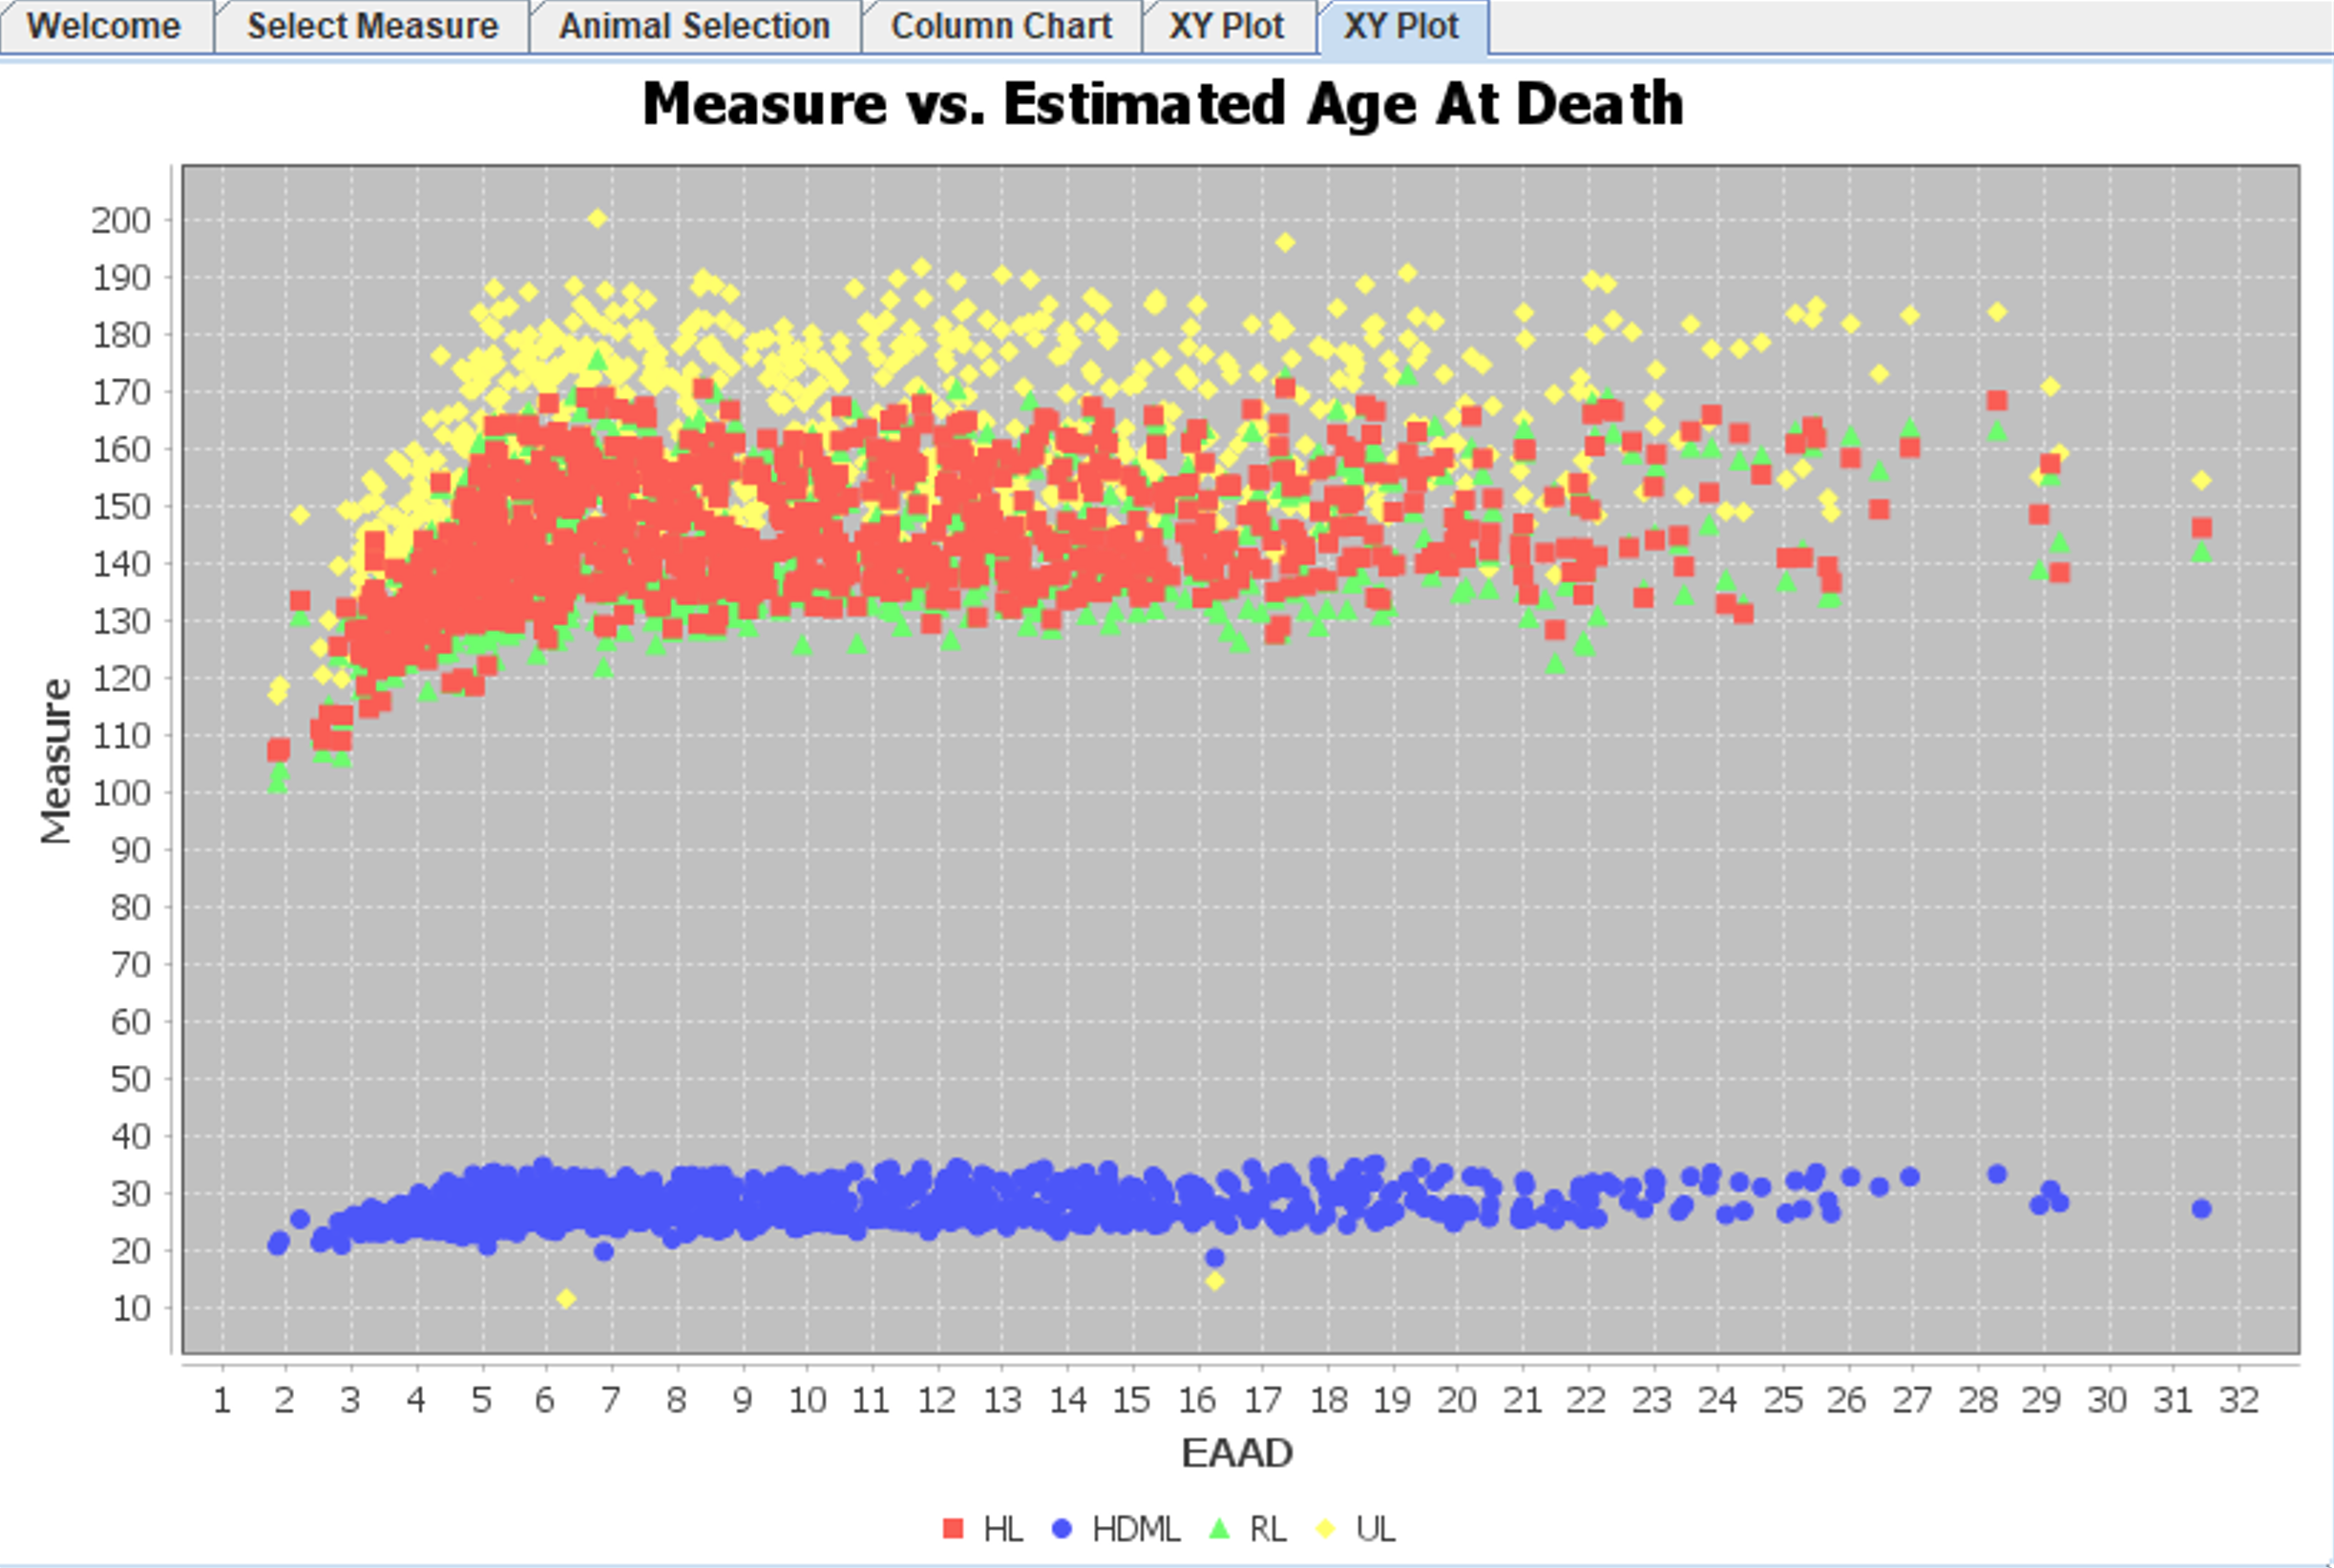
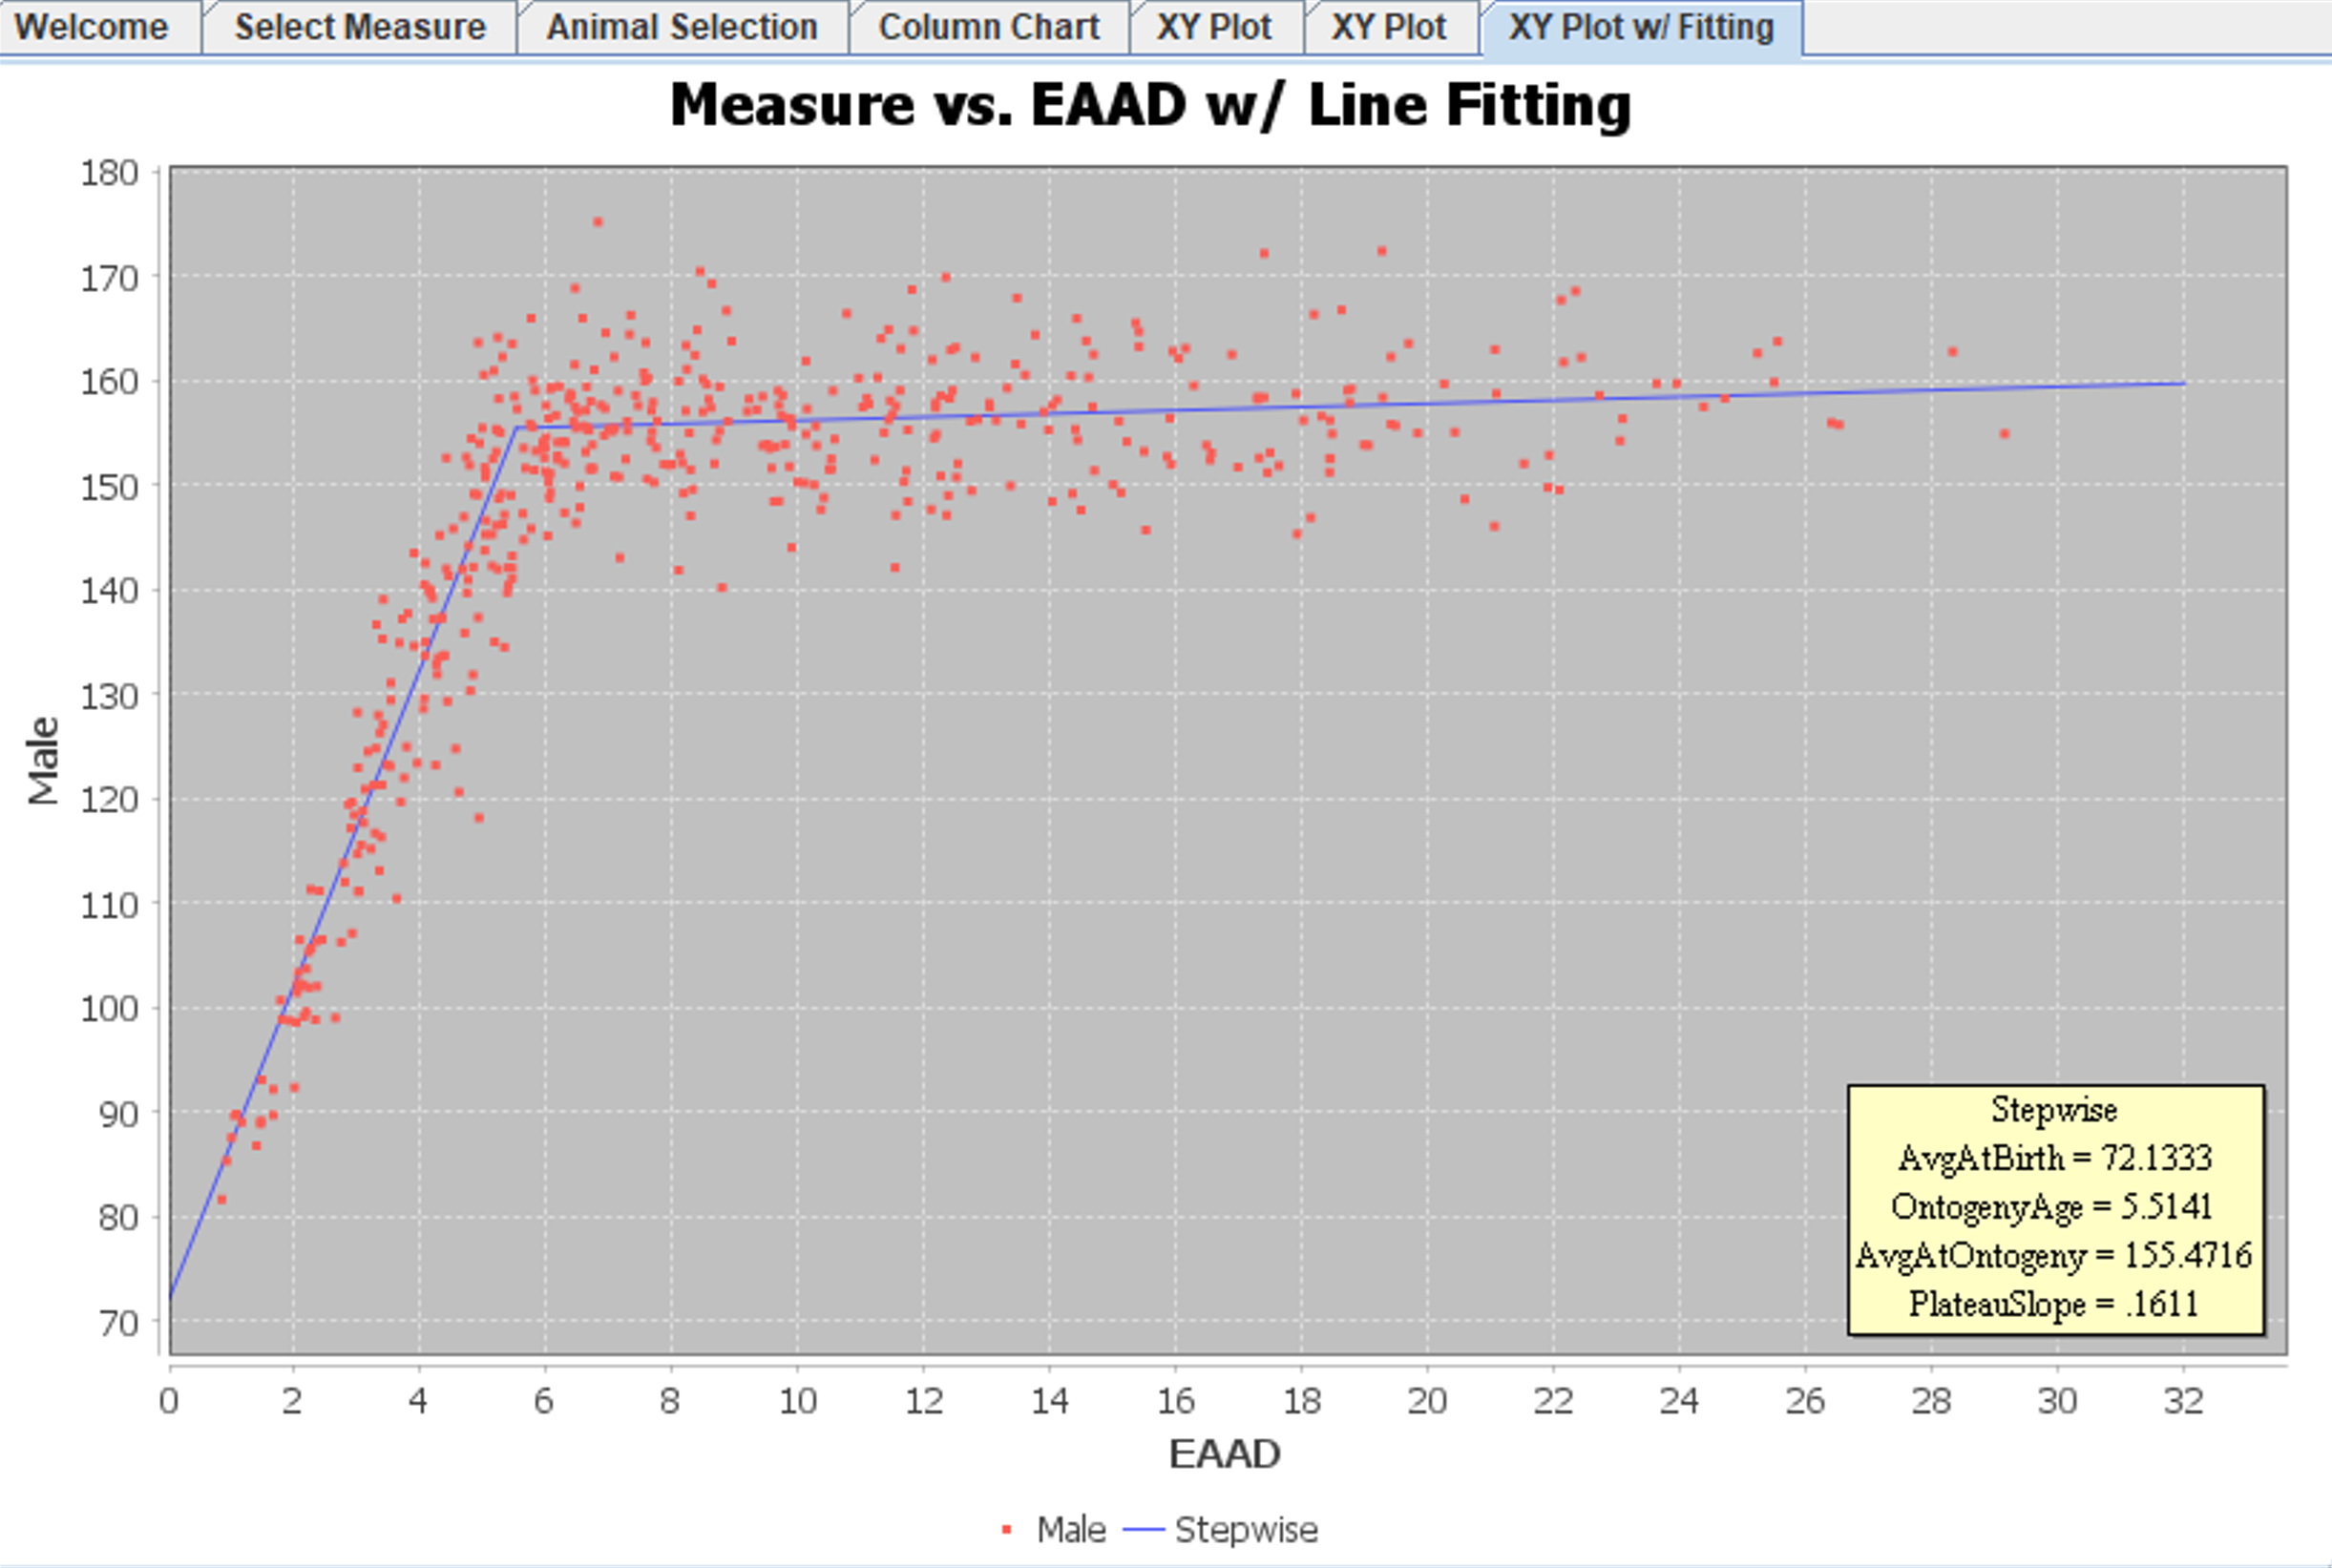
Numeric Measures vs. EAAD
Line Fitting (for numeric measure vs. EAAD)
Three Regression models are supported in the Analytics menu:
Linear
Logorithm
Stepwise (two straight-line segments)
Custom Regression Using Various Models